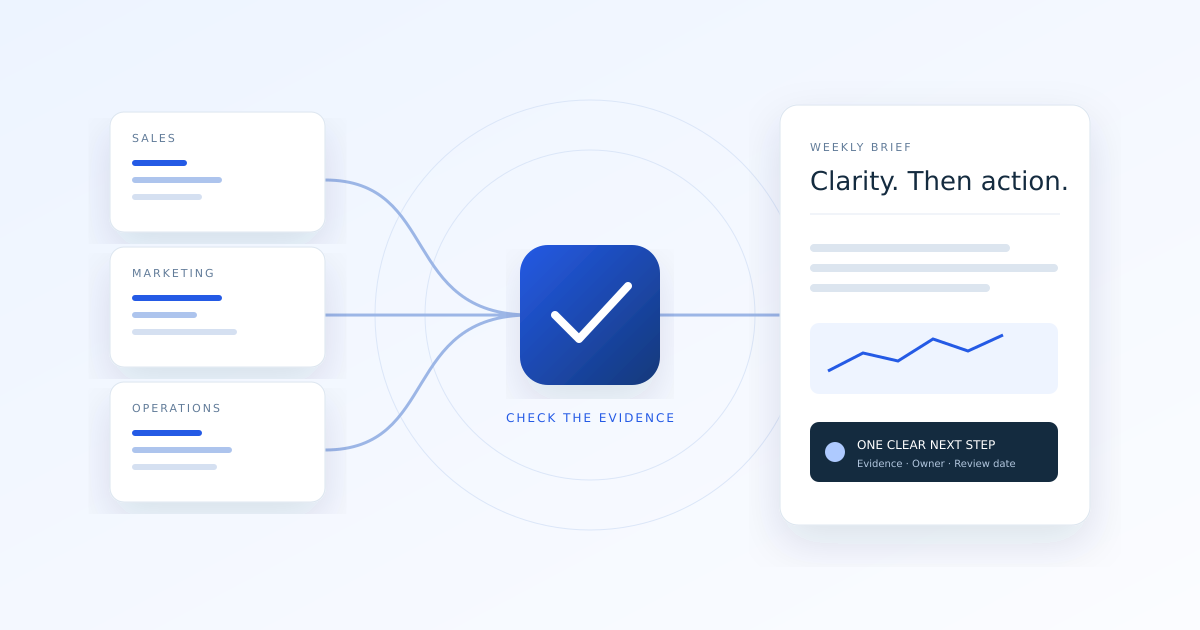
A useful weekly report answers three questions: what changed, what needs attention, and who will act. An AI-generated paragraph can make those answers easier to read, but it cannot repair a missing data source or turn a guess into an explanation.
Here is a recommended workflow for a small business combining sales, marketing or operational information. It is an illustrative operating design, not a customer case study or a promise of savings. Start with one decision and a handful of metrics rather than automating every dashboard at once.
1. Define the report before connecting the tools
Write a short reporting agreement. Specify the reader, the decision the report supports, its reporting period, time zone, delivery time and owner. Choose metrics that help that reader act. A marketing owner might need ad spend, qualified inquiries and confirmed purchases; an operations owner might need open work, overdue items and completed jobs.
For every metric, record its source and definition. “Revenue” could mean orders placed, paid invoices or net payments after refunds. Those are different measures. Do not combine them under one label or let a model choose a definition each week.
- Metric: confirmed purchases.
- Definition: distinct paid order IDs, excluding test orders.
- Period: Monday through Sunday in the agreed business time zone.
- Source: the designated order system, with a saved report link.
- Owner: the person who can resolve discrepancies.
2. Give each source a freshness check
Record both when the data was retrieved and the latest period it covers. A successful connection today does not mean every record is complete through today. Google notes that Analytics processing can take 24–48 hours and that reports may change during processing. Its data freshness guidance is a reason to label recent analytics figures as provisional, not a universal waiting period for every tool.
Choose a cutoff that fits the sources. For example, prepare a Monday operational digest from current work records, but allow additional processing time for a finalized analytics comparison. If the business needs an early report, label it preliminary and specify which figures may change.
When a source fails, retain its previous retrieval time and mark it unavailable or stale. Never quietly reuse last week’s figures as though they were current. Missing is not zero: an empty response caused by a disconnected account must not become “no sales.”
3. Calculate first, explain second
Use a spreadsheet formula or tested code to calculate totals, rates and period changes from the selected records. Give AI the checked results and their definitions, rather than asking it to reconstruct arithmetic from scattered screenshots.
Compare like periods and keep units explicit. A seven-day total should not be compared with a partial week without a warning. If last week’s value was zero, percentage growth is not a useful finite number; show the absolute change instead. For a rate, show both its numerator and denominator so a large-looking change from a very small sample is visible.
Illustrative check: inquiries rise from 20 to 25. That is five more inquiries, or 25% growth. It does not establish that a new campaign caused the increase, and it says nothing about lead quality until the qualification data is checked.
Before drafting, validate that expected sources arrived, dates match, duplicate record IDs are removed according to the metric definition, and totals reconcile to the source report. Define tolerances with the business owner. An unexplained mismatch belongs in an exception, not in a polished summary.
4. Separate observations, hypotheses and actions
The report should make the strength of each statement obvious. NIST identifies confidently stated false content, or confabulation, as a generative-AI risk in its Generative AI Profile. A practical response is to require a source for observations and label possible explanations as hypotheses.
- Observation: “Five more qualified inquiries were recorded than last week.” Include the source, period and definition.
- Hypothesis: “The revised landing page may have contributed.” State what evidence is missing.
- Next action: “Compare inquiry source and qualification rates before changing spend.” Name an owner and review date.
Do not allow the draft to invent a reason for every movement. “The cause is not established” can be the most useful sentence in the report. Keep financial commitments, pricing changes and other consequential actions outside the reporting automation unless separately authorized.
5. Deliver a short brief with a traceable appendix
Put the decision-ready summary first and supporting detail behind it. A compact structure is easier to review than a stream of dashboards:
- Coverage: reporting dates, time zone and freshness status.
- What changed: three or fewer meaningful observations with comparisons.
- Needs attention: data gaps, unusual results or overdue work.
- Next steps: action, owner and intended review date.
- Evidence: source links, definitions and calculation notes.
Share only what the audience needs. Prefer aggregated figures when individual customer or employee records are unnecessary, and check that linked source reports have appropriate permissions. Do not broaden access just to make a link convenient.
6. Test the failure cases before scheduling it
Run the report alongside the existing manual process for several cycles. Deliberately test a missing source, duplicate records, a zero baseline, a late refund and a changed metric name. The report should show a clear exception, not silently produce a confident answer.
Give each report a stable period identifier and version. Record whether delivery was accepted, and check an uncertain send before retrying so people do not receive duplicate reports. If corrected data changes an important conclusion, issue a clearly labeled correction that explains what changed.
Evaluate the workflow by factual corrections, unresolved data gaps, review effort and whether the named actions were useful. A shorter drafting time is welcome, but it is not enough if the report makes the wrong decision easier.
A simple starting point
Pick one weekly decision, three to five metrics and one accountable reviewer. Automate collection and deterministic checks first. Add AI summarization only after the source figures are dependable. Then expand if the report consistently helps someone decide what to do next.
Explore our business reporting automation approach, or use the first-workflow selection guide to choose a smaller starting project. If your report highlights unanswered inquiries, our lead follow-up guide covers the handoff from insight to reviewed outreach.
Build a report your team can trust
Tell Clearwatch which reports you assemble, where the numbers live and which decisions they support. We can help design a focused workflow around your tools and review process.
Discuss your reporting workflow ↗Sources and scope
Sources checked November 15, 2026. The workflow is Clearwatch’s practical recommendation; examples are illustrative and do not represent customer results.